Ether’s price rebounded by nearly 400% after its RSI turned oversold the last time. Will this time be different?
Ethereum’s native token Ether (ETH) entered its “oversold” territory this June 12, for the first time since November 2018, according to its weekly relative strength index (RSI).
ETH eyes oversold bounce
Traditional analysts consider an asset to be excessively sold after its RSI reading fall below 30. Furthermore, they also see the drop as an opportunity to buy the dip, believing an oversold signal would lead to a trend reversal.
Ether’s previous oversold reading appeared in the week ending on Nov. 12, 2018, which preceded a roughly 400% price rally, as shown below.
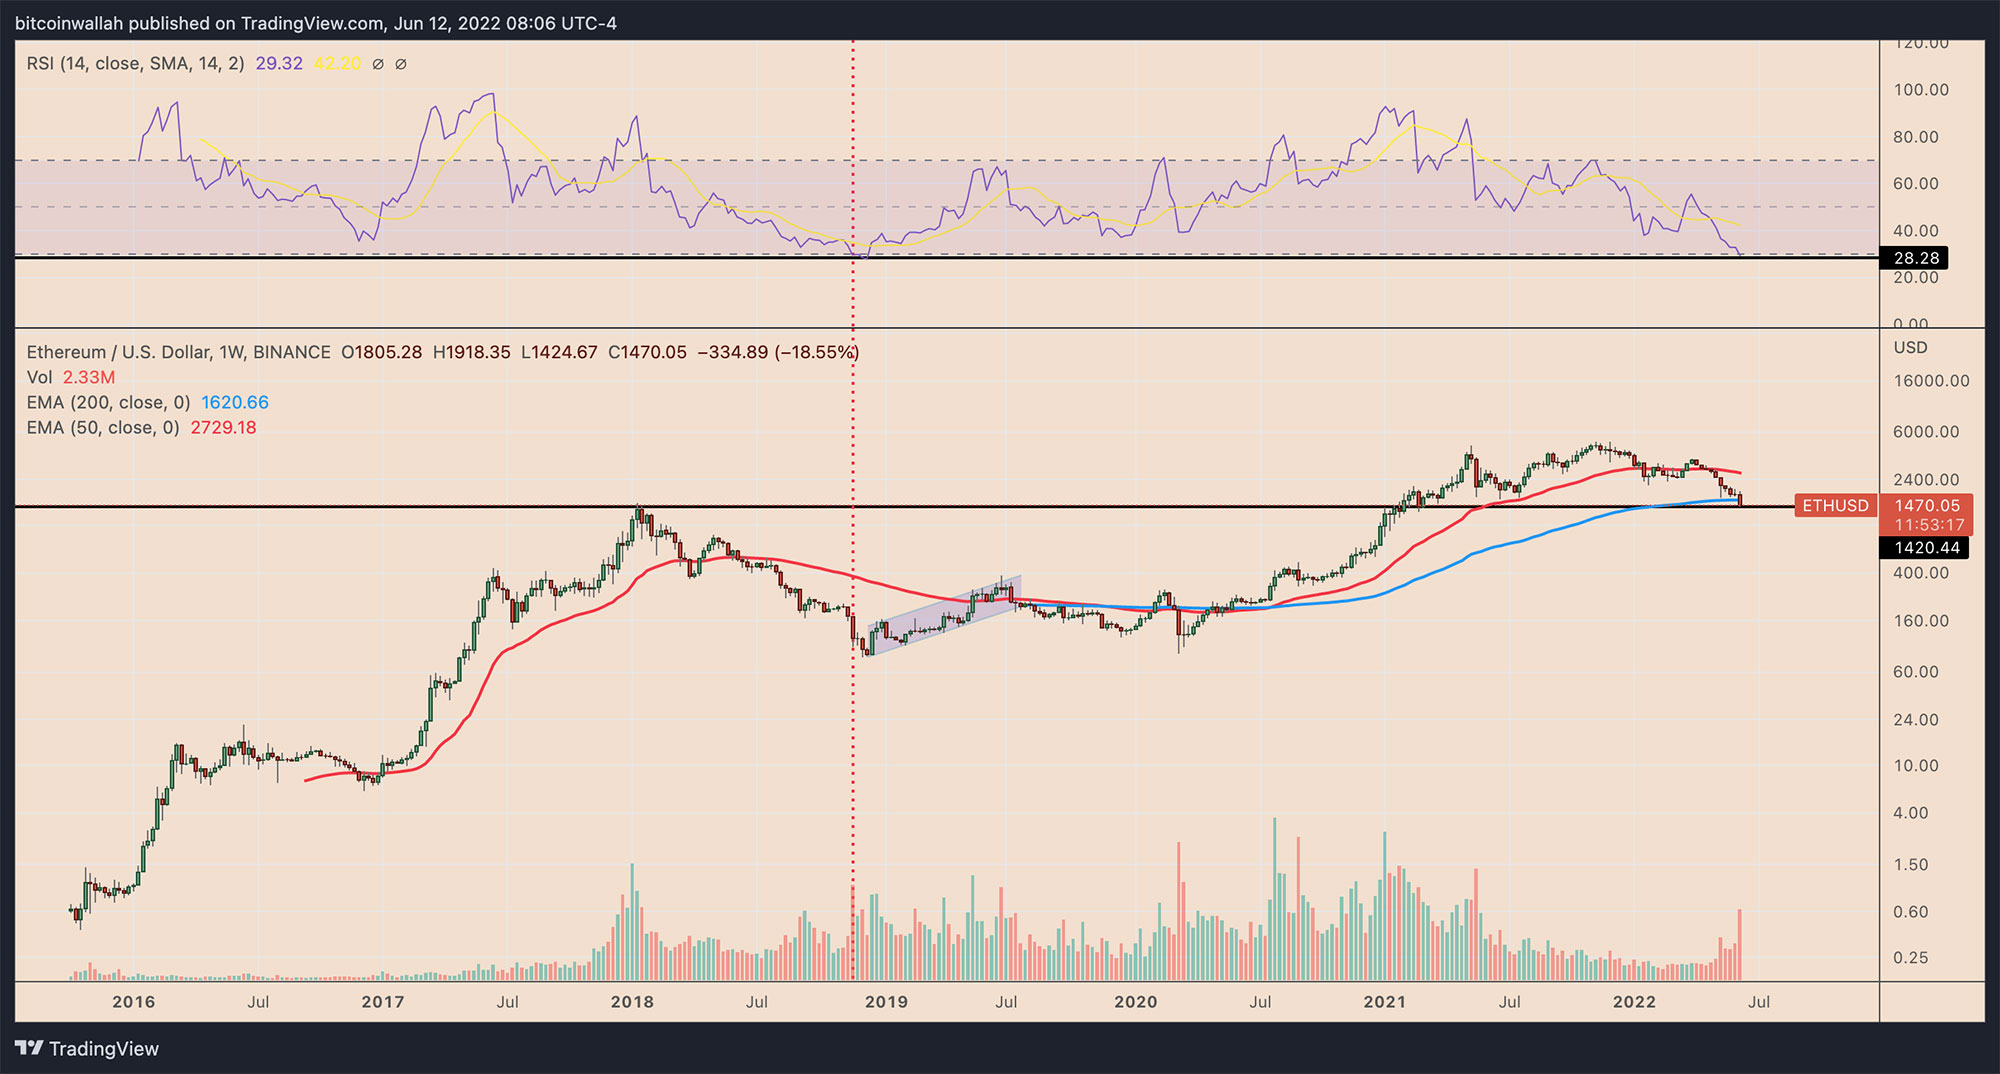
While past performances are not indicators of future trends, the latest RSI’s move below 30 raises the possibility of Ether undergoing a similar—if not an equally sharp—upside retracement in the future.
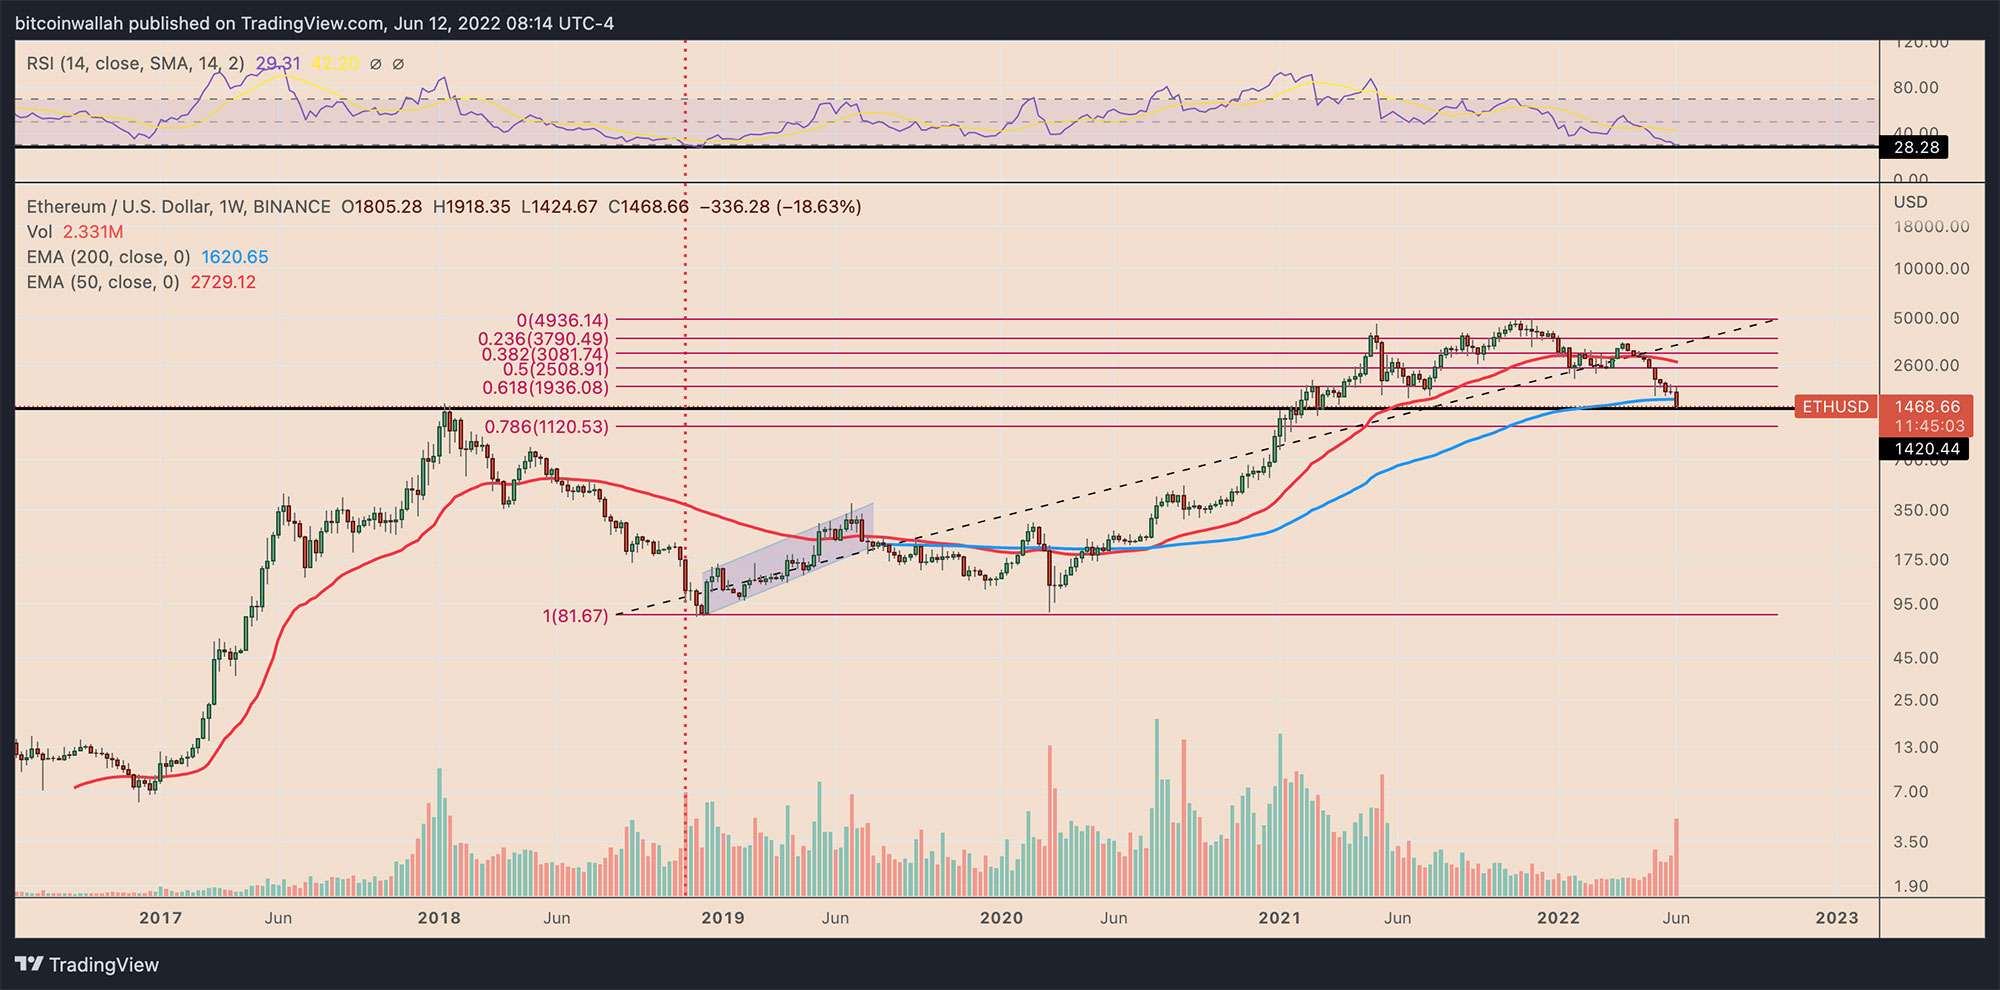
Suppose ETH logs an oversold bounce. Then, the ETH/USD pair’s immediate challenge would be to reclaim its 200-week exponential moving average (200-week EMA; the blue wave) near $1,620 as its support.

If it does, bulls could eye an extended upside move toward the 50-week EMA (the red wave) above $2,700, up almost 100% from the price of June 12.
If not, Ether could resume its downtrend, with $1,120 serving as the next target, a level coinciding with the token’s 0.782 Fib line, as shown in the chart below.
Macro headwinds and a $650 Ether price target
The RSI-based bullish outlook appears against a flurry of bearish headwinds, ranging from persistently higher inflation to a classic technical indicator with a downward bias.
In detail, Ether’s price declined by more than 20% in the last six days, with most losses coming after June 10, when the United States Labor Department reported that the inflation reached 8.6% in May, the highest since December 1981.
The higher consumer price index (CPI) strengthened fears among investors that it would force the Federal Reserve to hike interest rates more aggressively while slashing its $9 trillion balance sheet. That dampened appetite for riskier assets, hurting stocks, Bitcoin (BTC) and ETH.
Independent analyst Vince Prince fears the latest ETH decline could extend until the price reaches $650. At the core of his downside target is a massive head and shoulders — a classic bearish reversal pattern with an 85% success rate in meeting its profit target, according to Samurai Trading Academy.
Meanwhile, Glassnode’s lead on-chain analyst, known by the pseudonym Checkmate, highlighted a potential decentralized finance (DeFi) disaster that could crash Ether’s price further into 2022. Read More at COINTELEGRAPH![]()
Please Read Essential Disclaimer Information Here.
© 2024 Crypto Caster provides information. CryptoCaster.world does not provide investment advice. Do your research before taking a market position on the purchase of cryptocurrency and other asset classes. Past performance of any asset is not indicative of future results. All rights reserved.
Contribute to CryptoCaster℠ Via Metamask or favorite wallet. Send Coin/Token to Addresses Provided Below.
Thank you!
BTC – bc1qgdnd752esyl4jv6nhz3ypuzwa6wav9wuzaeg9g
ETH – 0x7D8D76E60bFF59c5295Aa1b39D651f6735D6413D
MATIC – 0x7D8D76E60bFF59c5295Aa1b39D651f6735D6413D
LITECOIN – ltc1qxsgp5fykl0007hnwgl93zr9vngwd2jxwlddvqt